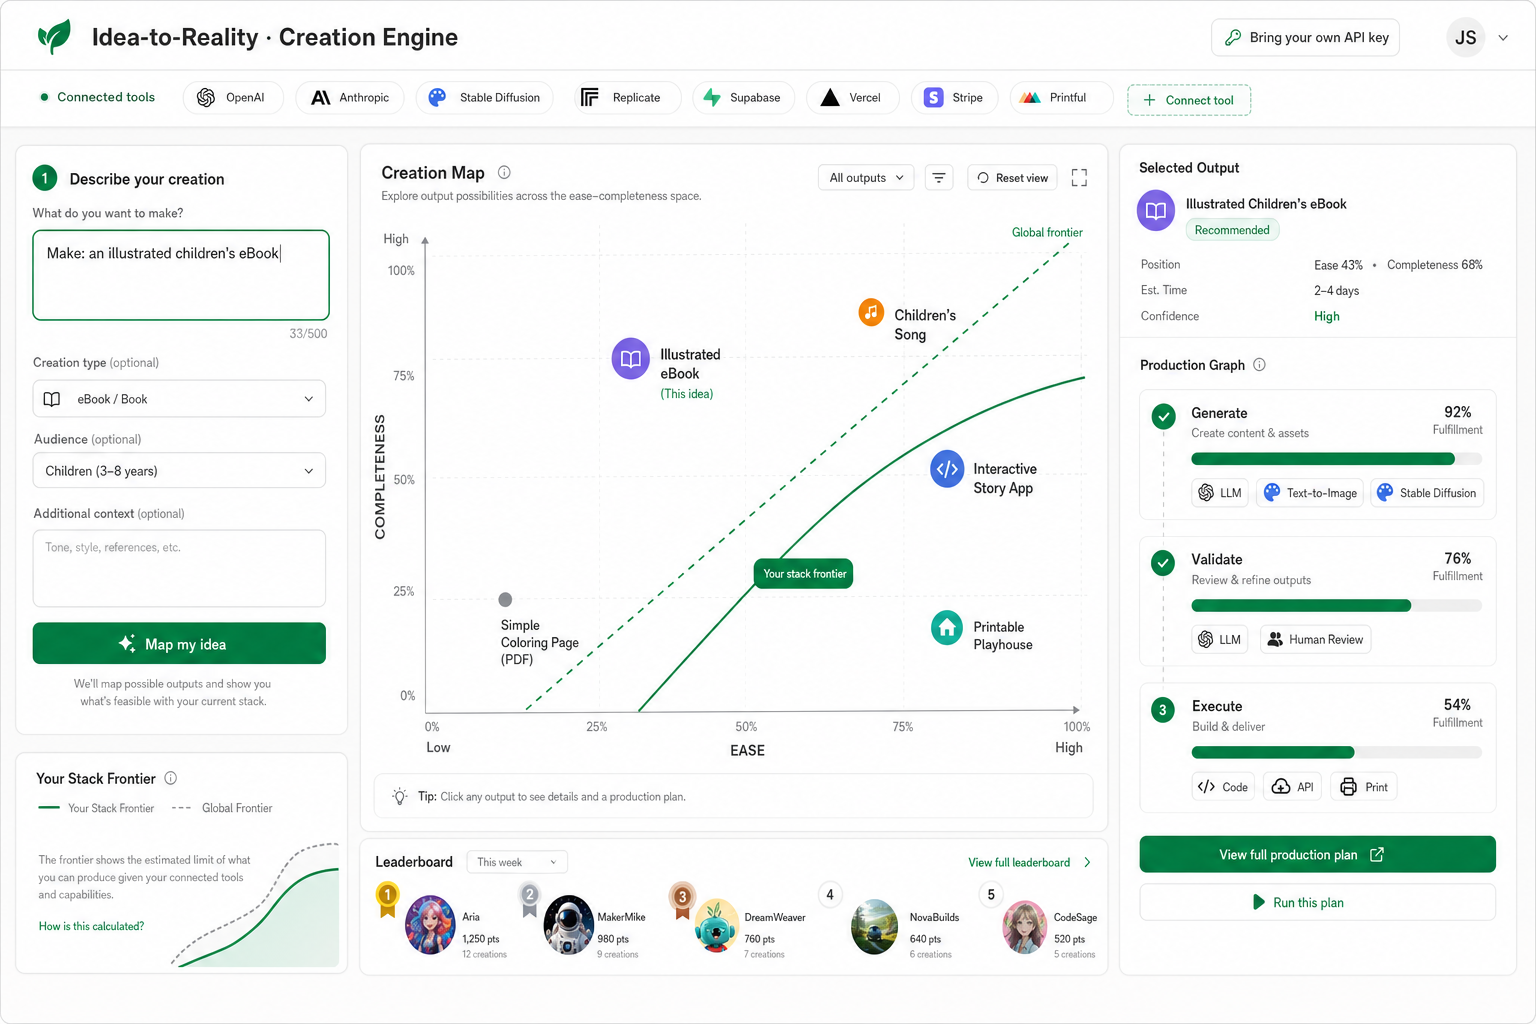
How the engine works
- Decompose the target artifact into a production graph (sub-artifacts + steps).
- Map each step to the best available tool, agent, or skill (LLM, text-to-image, code, API, human, robot).
- Score each step's fulfillment % and ease, then roll up to a composite for the whole artifact.
- Surface the gaps — the exact steps where a human (or a not-yet-existing capability) must enter.
- Place the artifact on the map and show the full stack required to make it real.
Architecture
One portable knowledge layer, two front doors. The data is the moat; the UI and the agent-skills are thin clients over it.
1 · Stack ontology
Artifact taxonomy, step graphs, tool/agent registry, and fulfillment + ease heuristics — plain versioned files. (This site reads its seed from data.js.)
2 · Estimator
A headless “make X” planner (CLI/API) that returns the decomposition, the stack, a completeness %, an ease score, and the gaps.
3 · Clients
This interactive map + blog, plus bring-your-own-key agent skills (Claude/Codex/Hermes/OpenClaw) that don't just describe the stack — they run it.
Layer 1 · the moat
The ontology: the map's source of truth
Everything you see on the map is a thin renderer over one small,
carefully-typed dataset called the ontology. Think of it
as the engine's dictionary of what can be made and what it
takes to make it. It answers three questions in plain data:
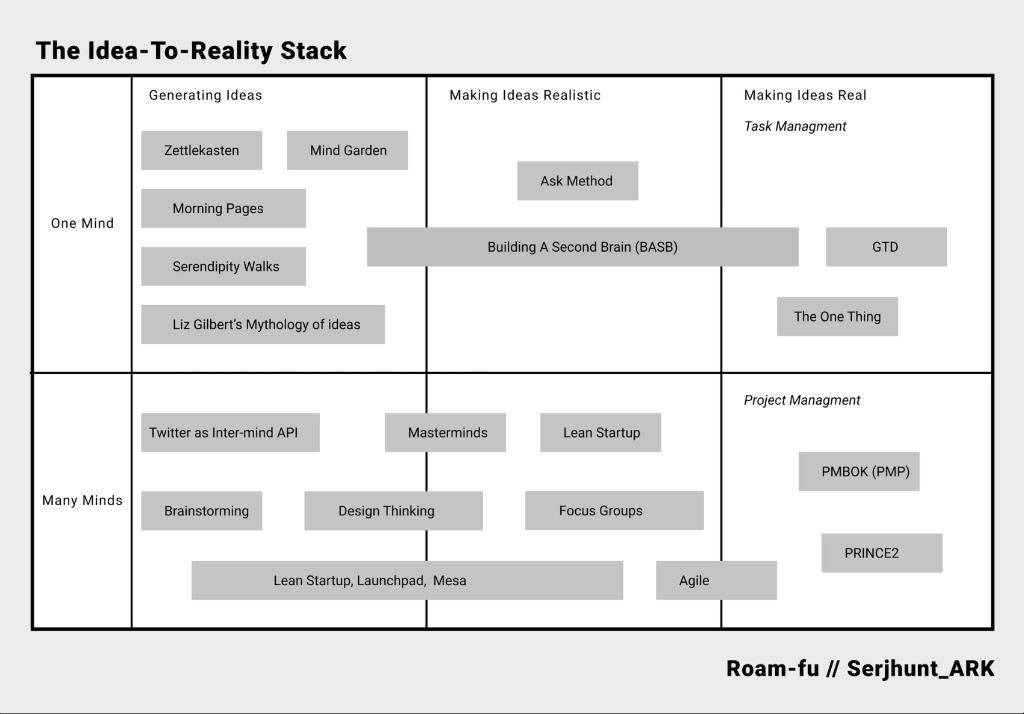
- What are the outputs? A catalogue of artifacts — a blog post, a song, a SaaS app, a house — each with its position on the ease × completeness map.
- What tools exist? A registry of every capability (LLM, text-to-image, CAD, a 3D printer, a human, regulators), each tagged with the year it became viable.
- How is each output made? A production graph: ordered steps across Generate → Validate → Execute, where every step cites the tools it needs and a fulfillment % for how much AI can do unaided.
37artifacts
56tools / agents
136production steps
5domains
It's written in TypeScript and validated with Zod, so the
data can't drift out of shape: every artifact, tool, and step is checked
against a schema, and the build refuses to publish if a step ever
cites a tool that doesn't exist. That's the honesty rule
made mechanical — no capability gets claimed unless it's a real,
registered tool. A single command re-validates the ontology and
regenerates the data.js this site reads.
// ontology/schema.ts — every step must cite at least one tool
const StepSchema = z.object({
  stage:       StageEnum,                 // generate | validate | execute
  name:        z.string().min(1),
  toolIds:     z.array(z.string()).min(1), // ← can't be empty: the honesty rule
  fulfillment: z.number().int().min(0).max(100),
});
The goal
Build the Creation Engine: a portable stack ontology plus a headless
estimator that, given a target output, returns its decomposition, the
required stack, a composite completeness % and ease score, the ordered plan,
and the human-in-the-loop gaps — rendered onto the ease ×
completeness map you see above.
Honesty rule: every fulfillment % cites the tool and maturity it's based on.
The map shows the capability frontier as it actually is, not as we wish it.
Coming next
The benchmark: plot your stack's frontier
The map above shows the global frontier. The next build is an
open eval that any stack can plug into — an agent,
a model, a toolchain, even a human + AI pair, bring your own API key.
It runs a battery of creation tasks, measures how much each one your
stack can actually finish, and draws your own frontier line
overlaid on this exact map.
Plug in any stack
Submit a stack manifest (model + tools + keys) and a thin adapter that turns a task brief into produced artifacts plus a run-log of the steps it took.
Four scored axes
Completeness (steps finished unaided), quality (rubric / judged), autonomy & ease (human steps, cost, time), and honesty (did it report its own gaps instead of overclaiming?).
Your frontier, overlaid
Results render as a contour on the map above — the line where your stack's completeness × quality drops off. That line is “where your capabilities end up.”
How a run works
- Pick a task set — start with auto-gradeable digital artifacts (blog post, landing page, small web app, song, eBook) with deterministic verification.
- Your adapter runs each brief and drops artifacts + a step log into an output folder.
- The harness verifies — programmatic checks first, judged quality second, with provenance (model versions, cost, timestamp) recorded.
- Scores roll up into the four axes and a composite reach.
- Your frontier is drawn on the map and added to a dated leaderboard, so different stacks — and the same stack over time — can be compared as the frontier moves.
Same honesty rule applies: physical artifacts (house, drug, spacecraft)
are scored only on their digital precursors, with the real-world remainder
labelled unevaluated rather than faked.